Overview
This report analyzes price changes for food products (Nahrungsmittel) across different brand categories at BILLA over 1, 2, and 3-year periods.
Total Products
3639
1-Year Data
2325
2-Year Data
2184
3-Year Data
1725
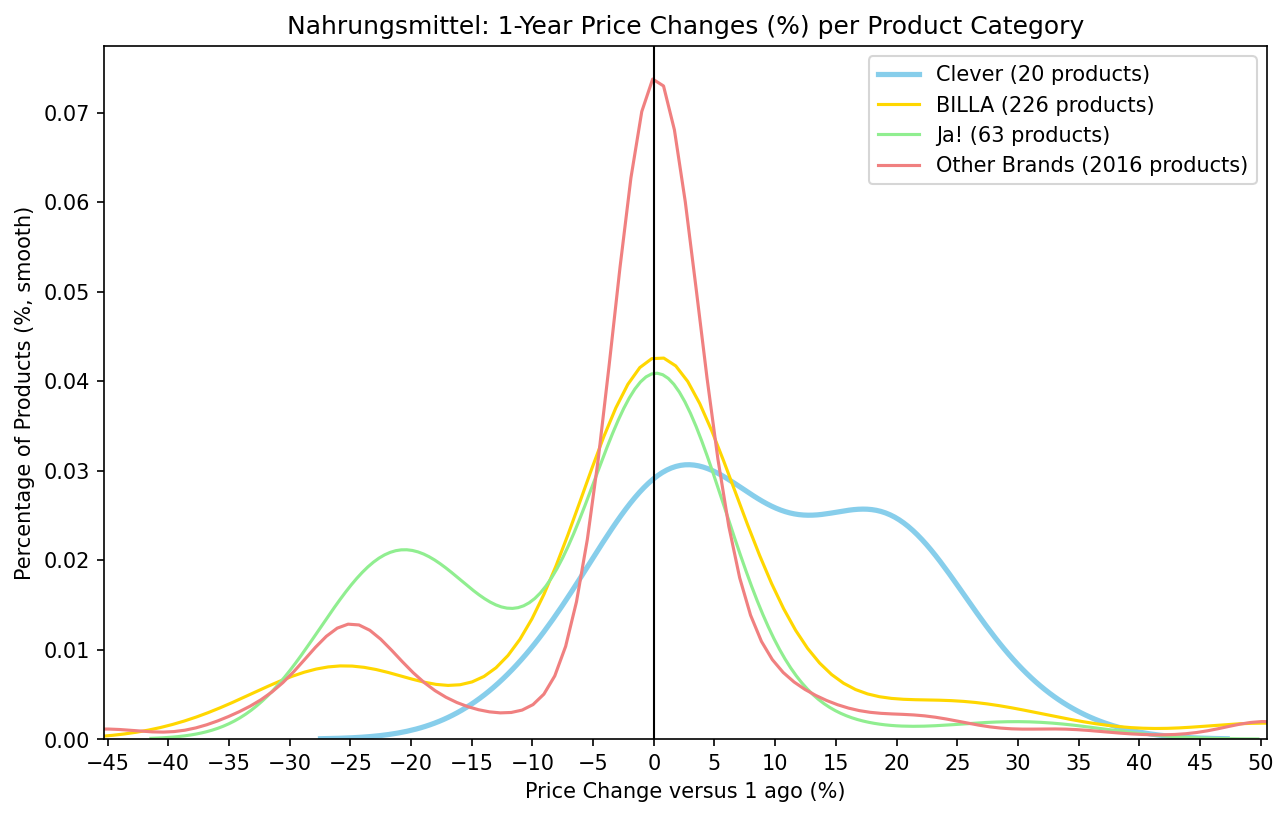
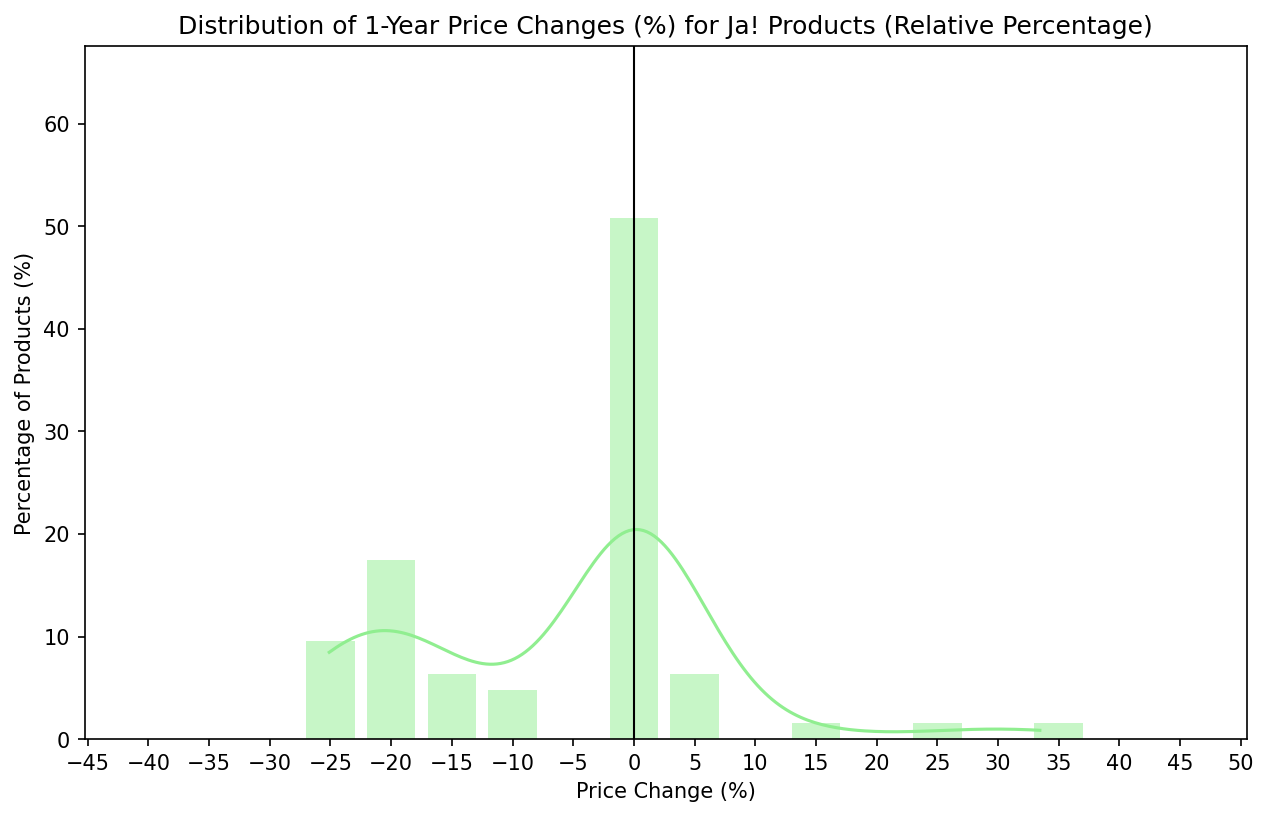
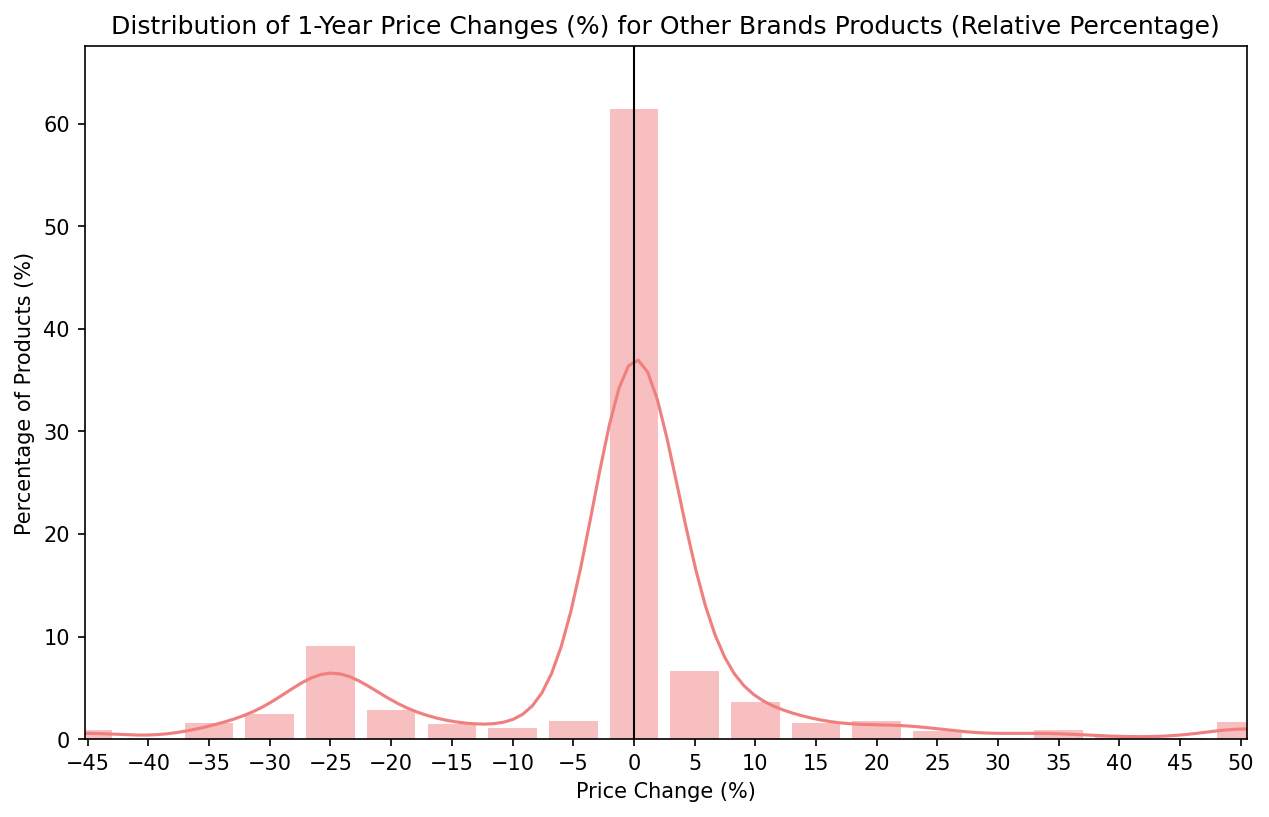
1-Year Price Change Analysis
Summary Statistics
Bins: 20 Range: -45.26% to 50.51%
| Brand Category | Product Count | Below Range | Above Range |
|---|---|---|---|
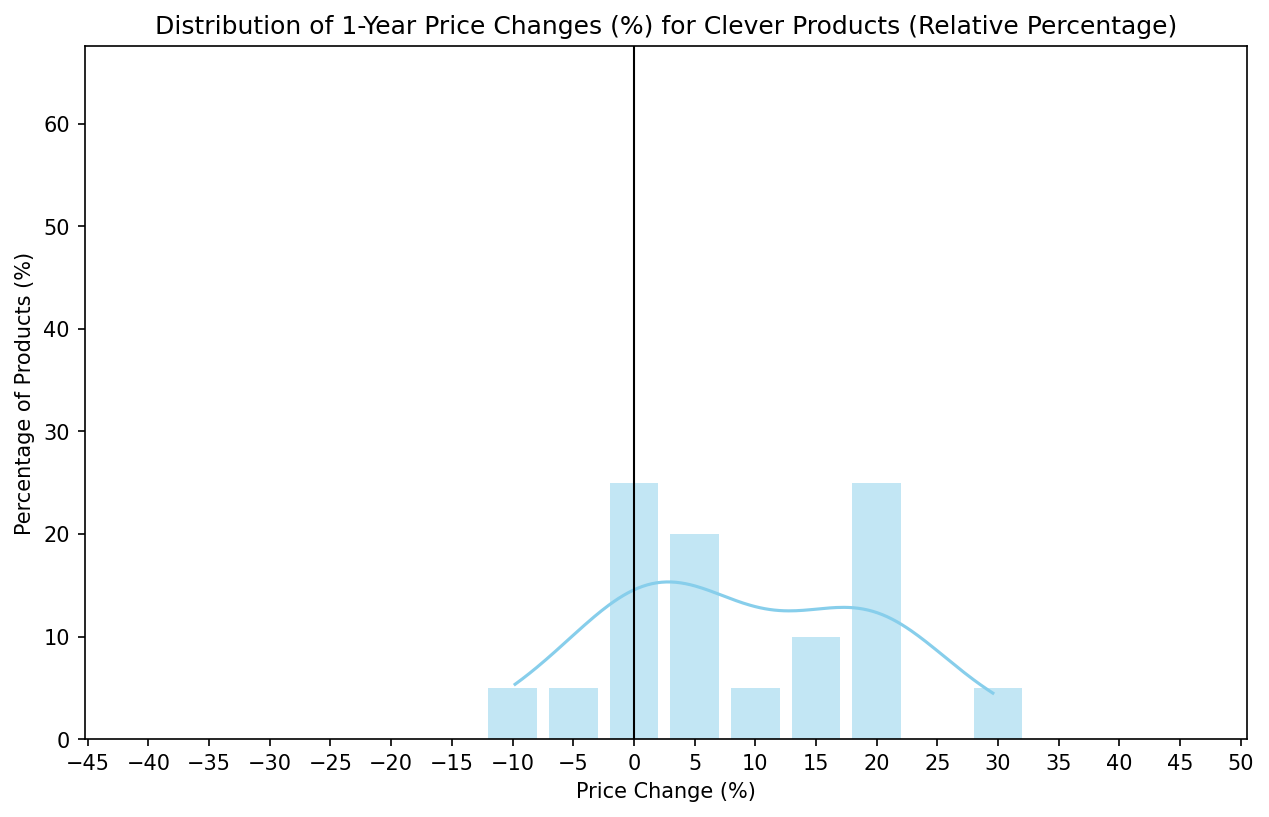
| Clever | 20 | 0.00% | 0.00% |
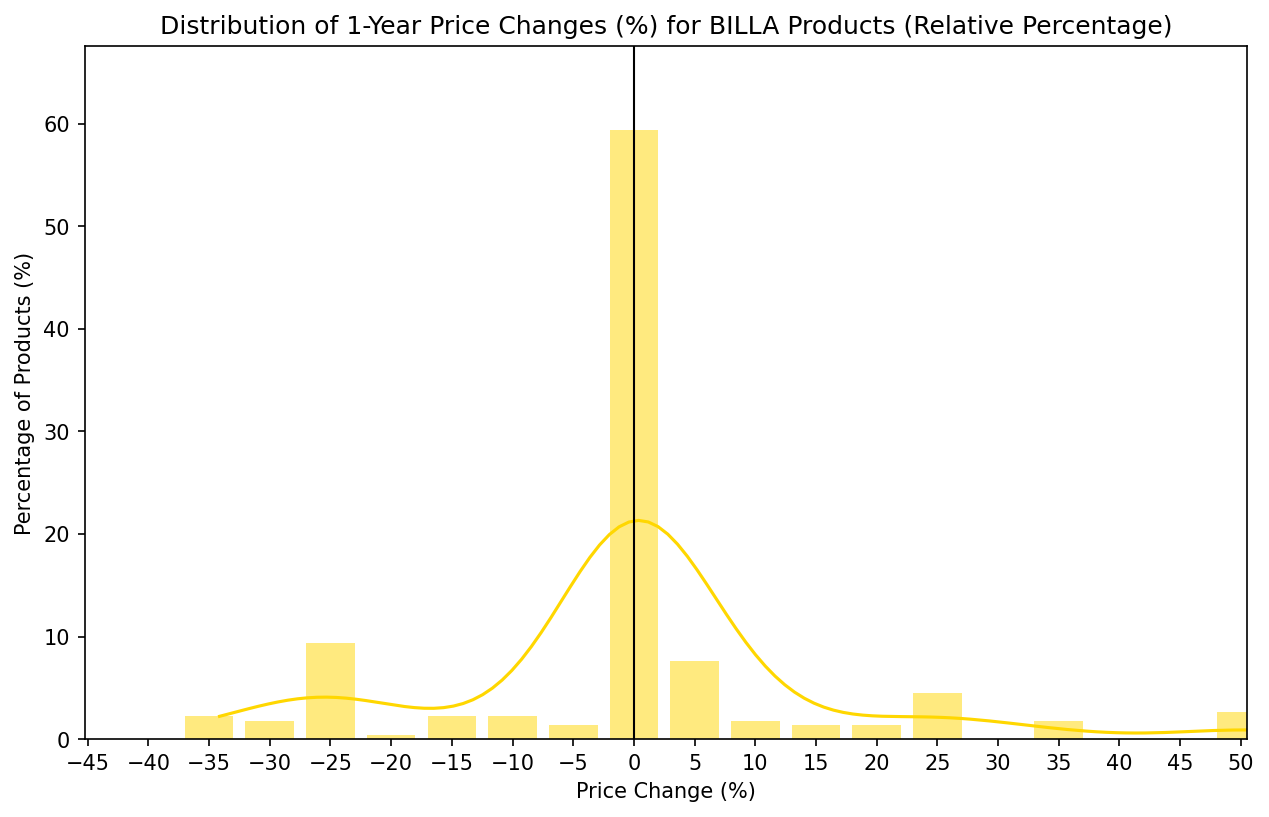
| BILLA | 226 | 0.00% | 0.88% |
| Ja! | 63 | 0.00% | 0.00% |
| Other Brands | 2016 | 0.89% | 0.69% |
Comparison of All Brand Categories
Individual Brand Category Distributions
Clever Products
BILLA Products
Ja! Products
Other Brands
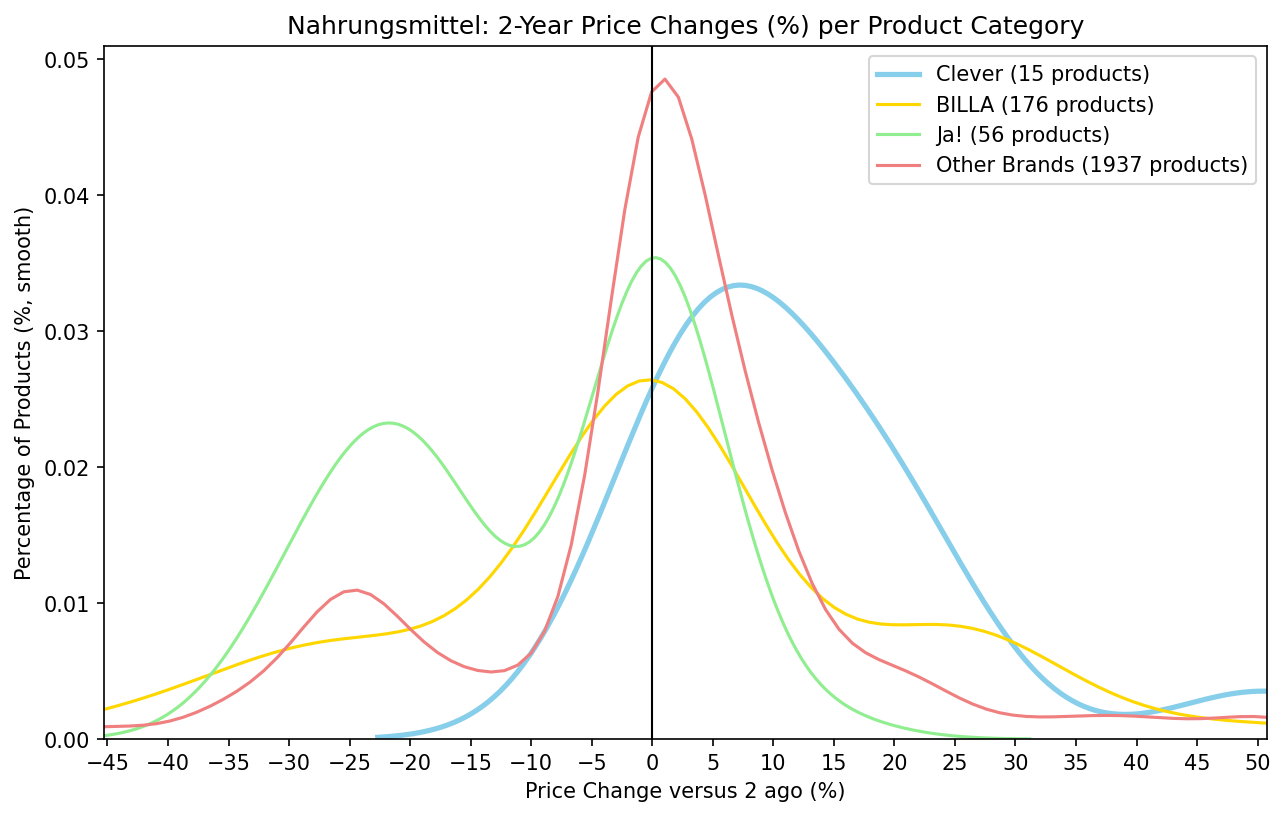
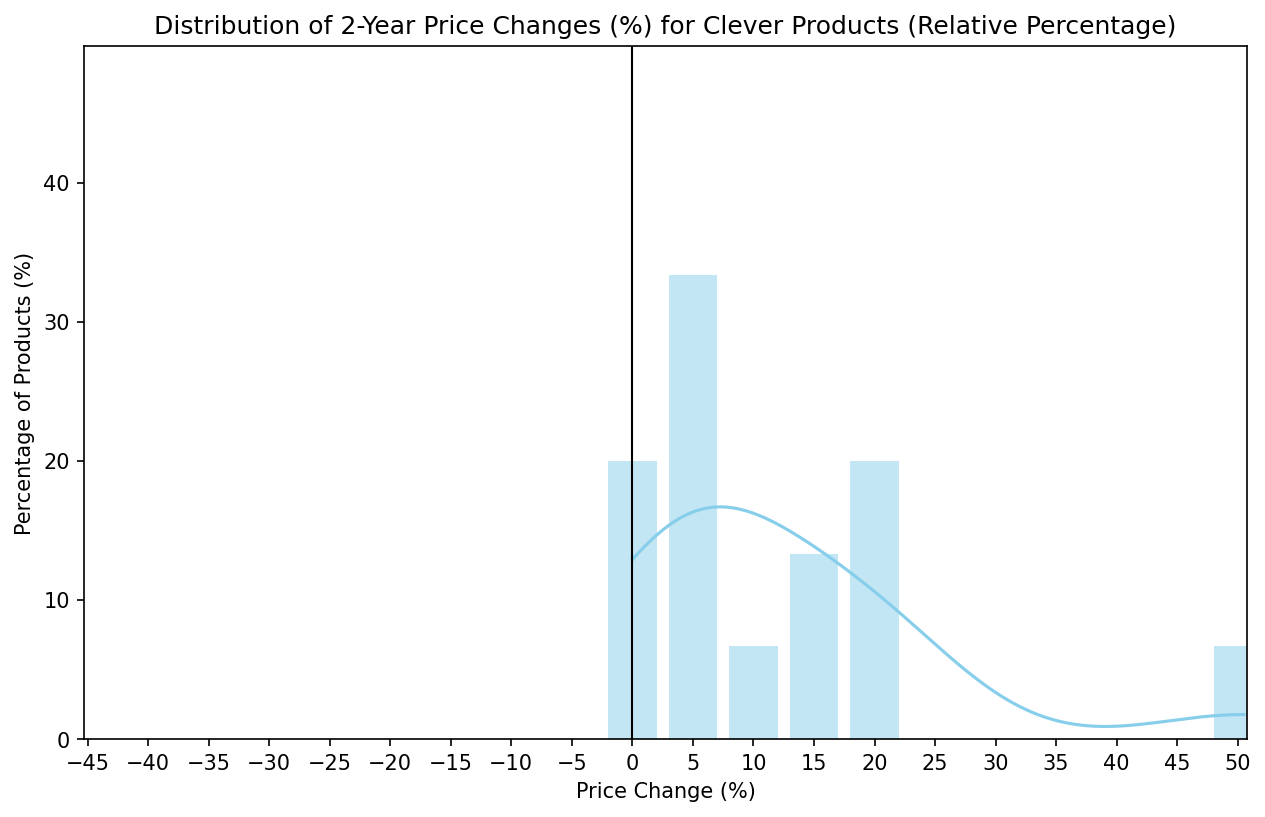
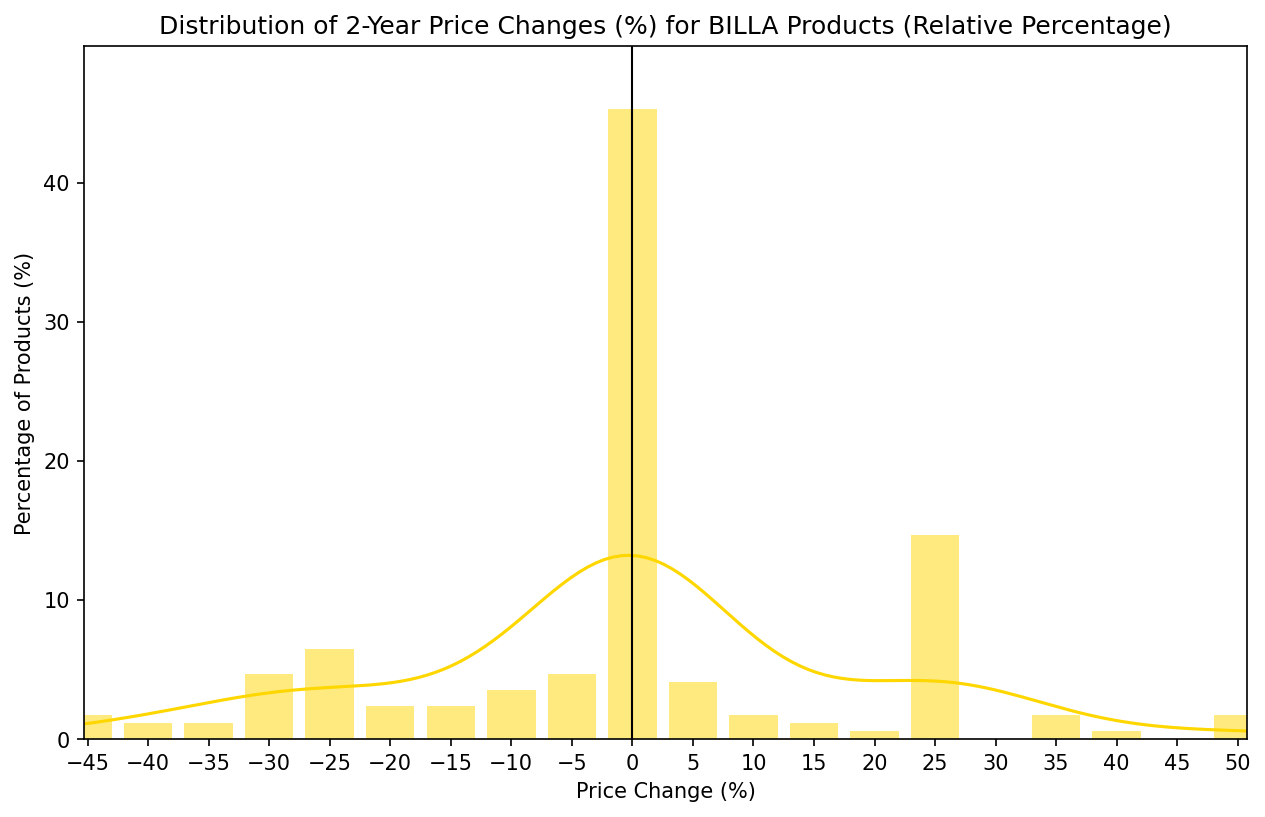
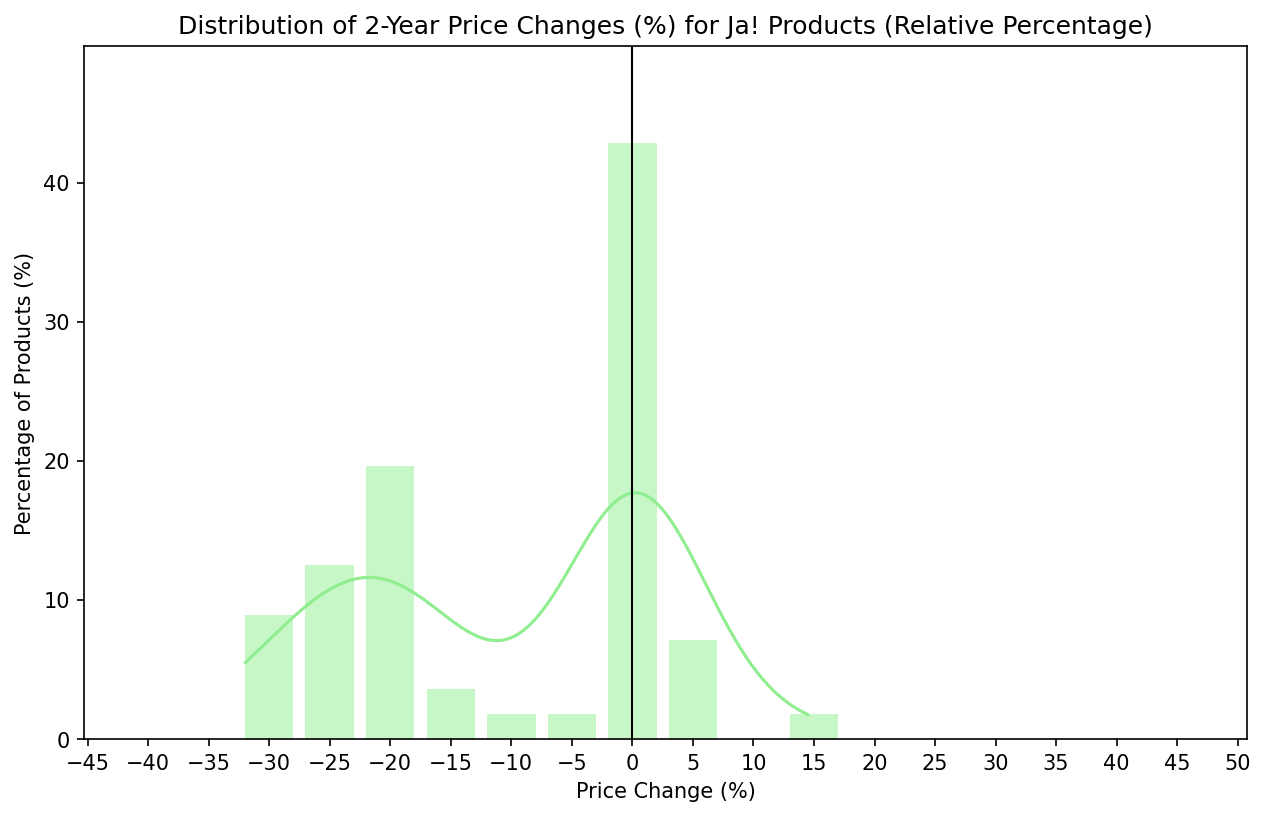
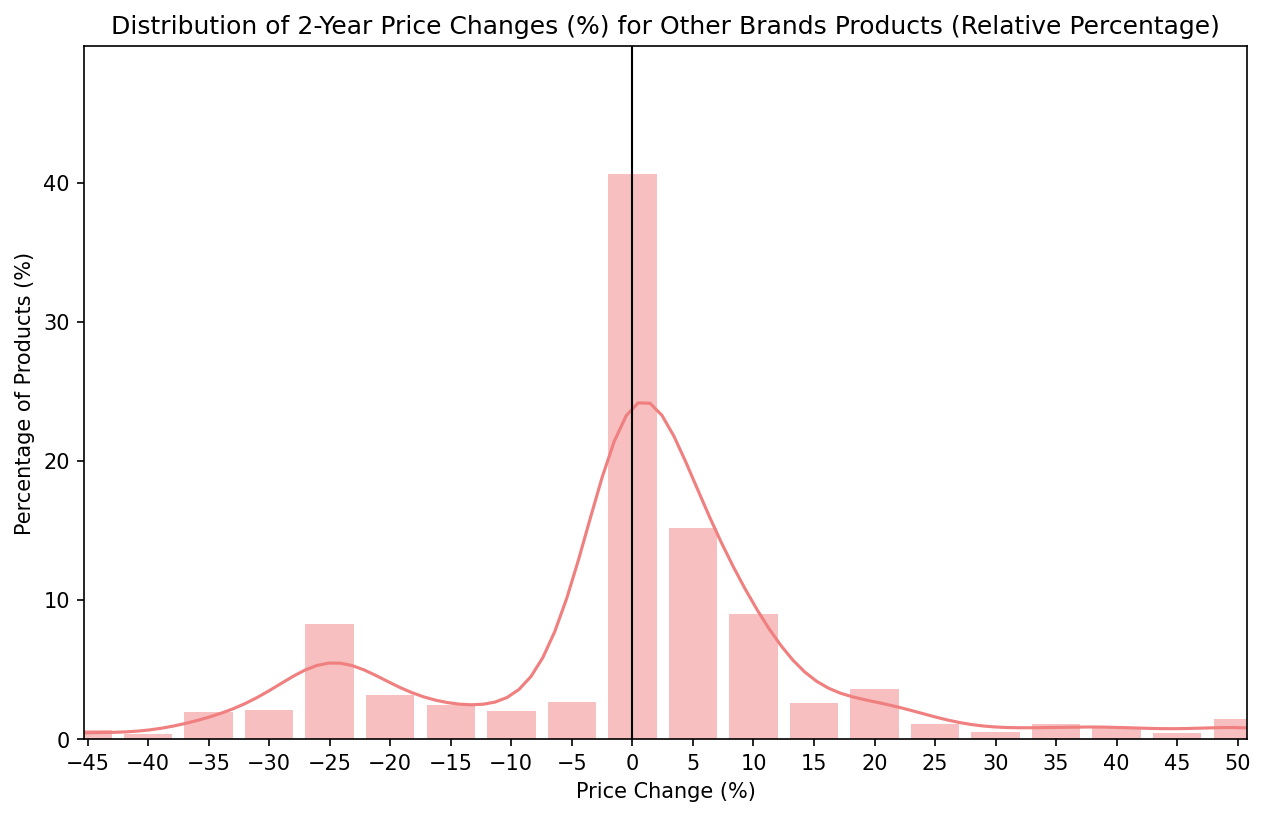
2-Year Price Change Analysis
Summary Statistics
Bins: 20 Range: -45.26% to 50.76%
| Brand Category | Product Count | Below Range | Above Range |
|---|---|---|---|
| Clever | 15 | 0.00% | 0.00% |
| BILLA | 176 | 0.57% | 2.84% |
| Ja! | 56 | 0.00% | 0.00% |
| Other Brands | 1937 | 0.93% | 0.83% |
Comparison of All Brand Categories
Individual Brand Category Distributions
Clever Products
BILLA Products
Ja! Products
Other Brands
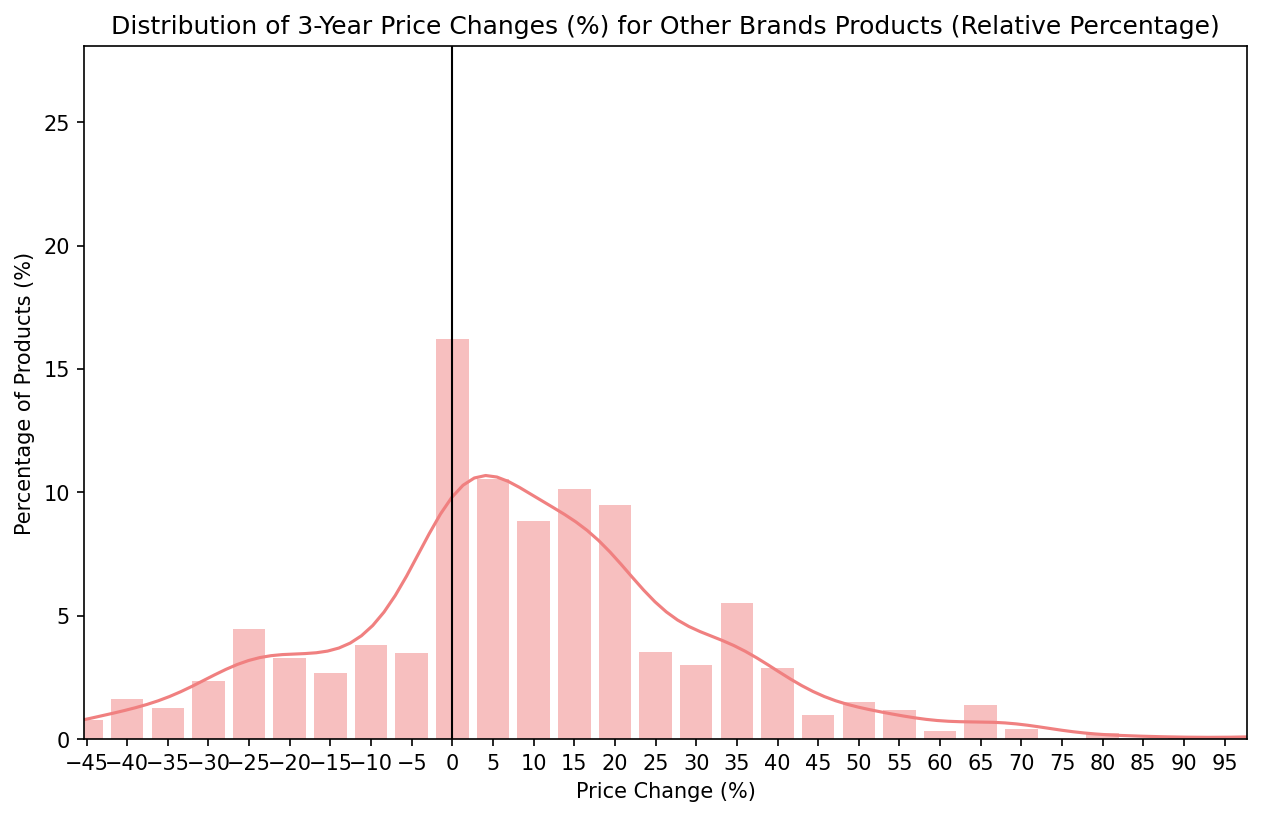
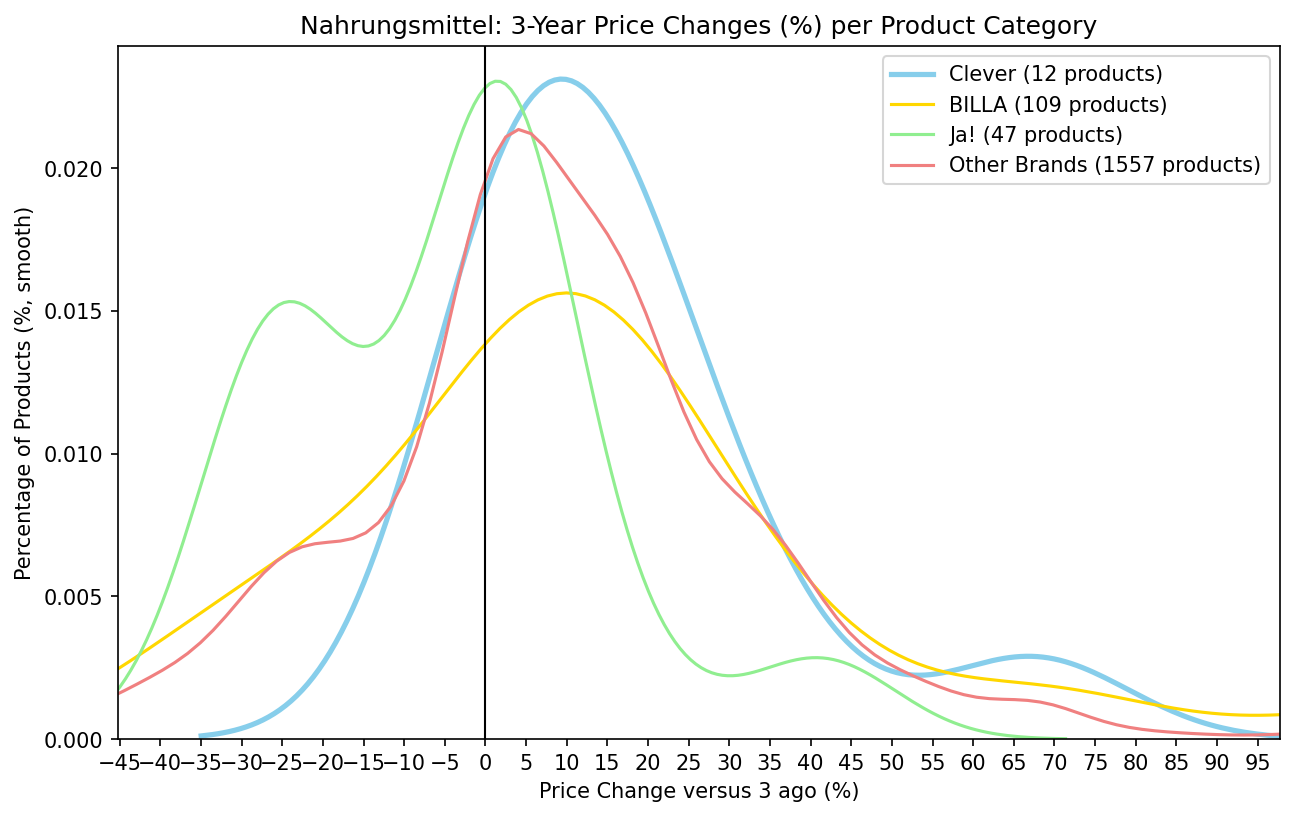
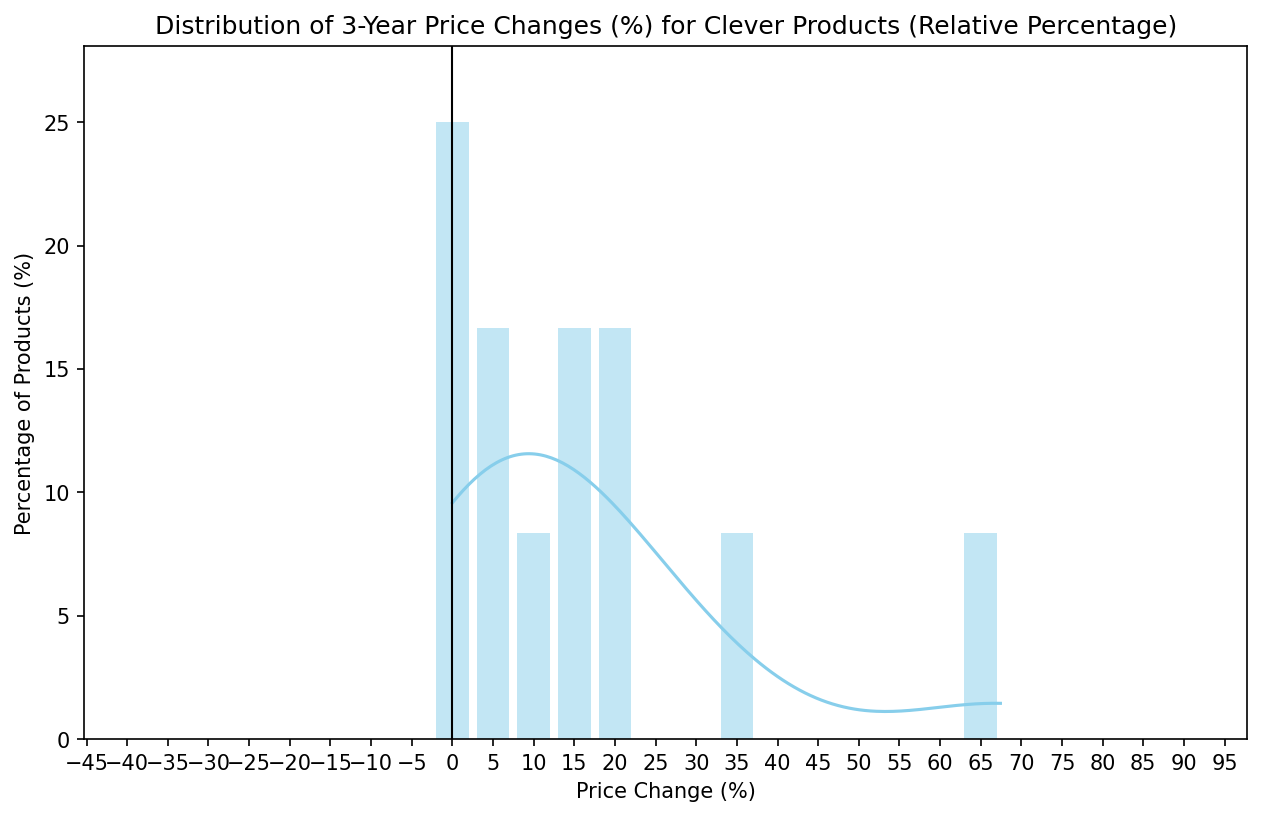
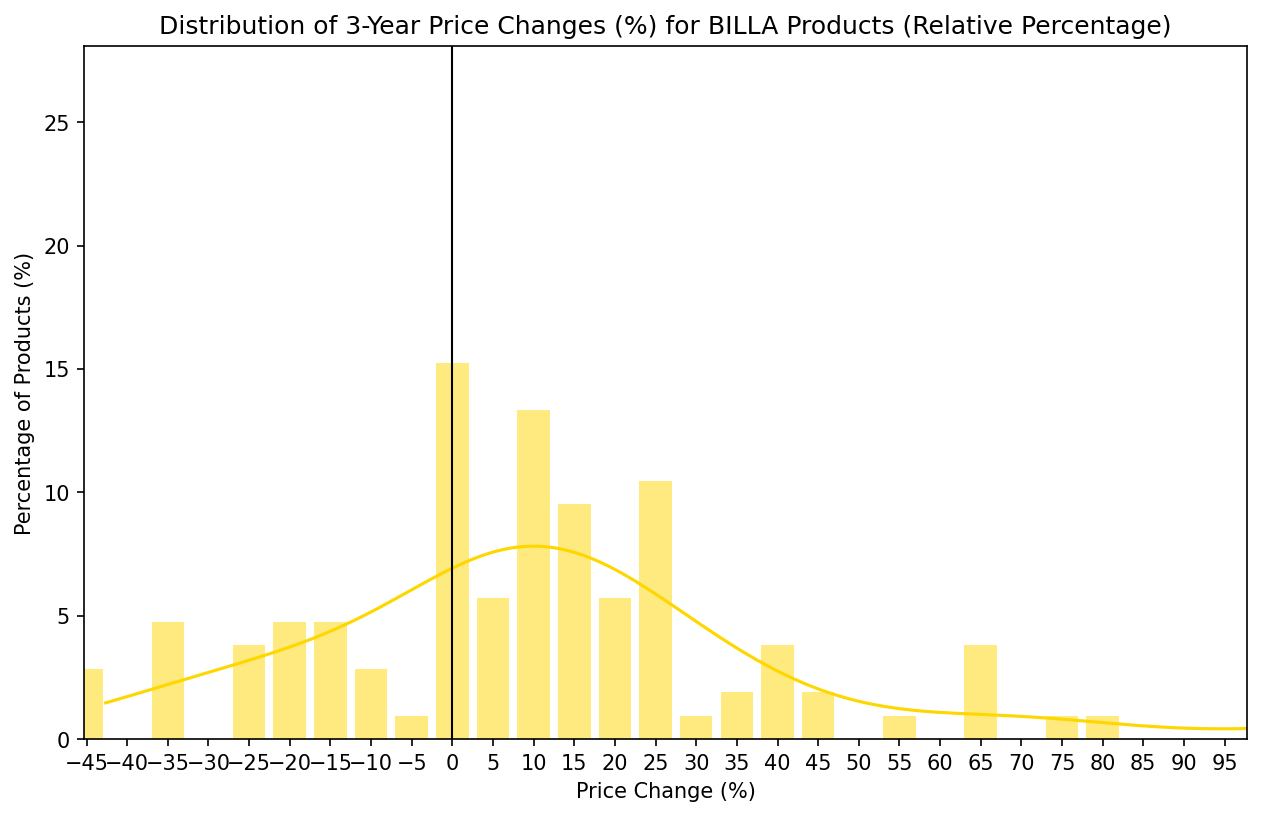
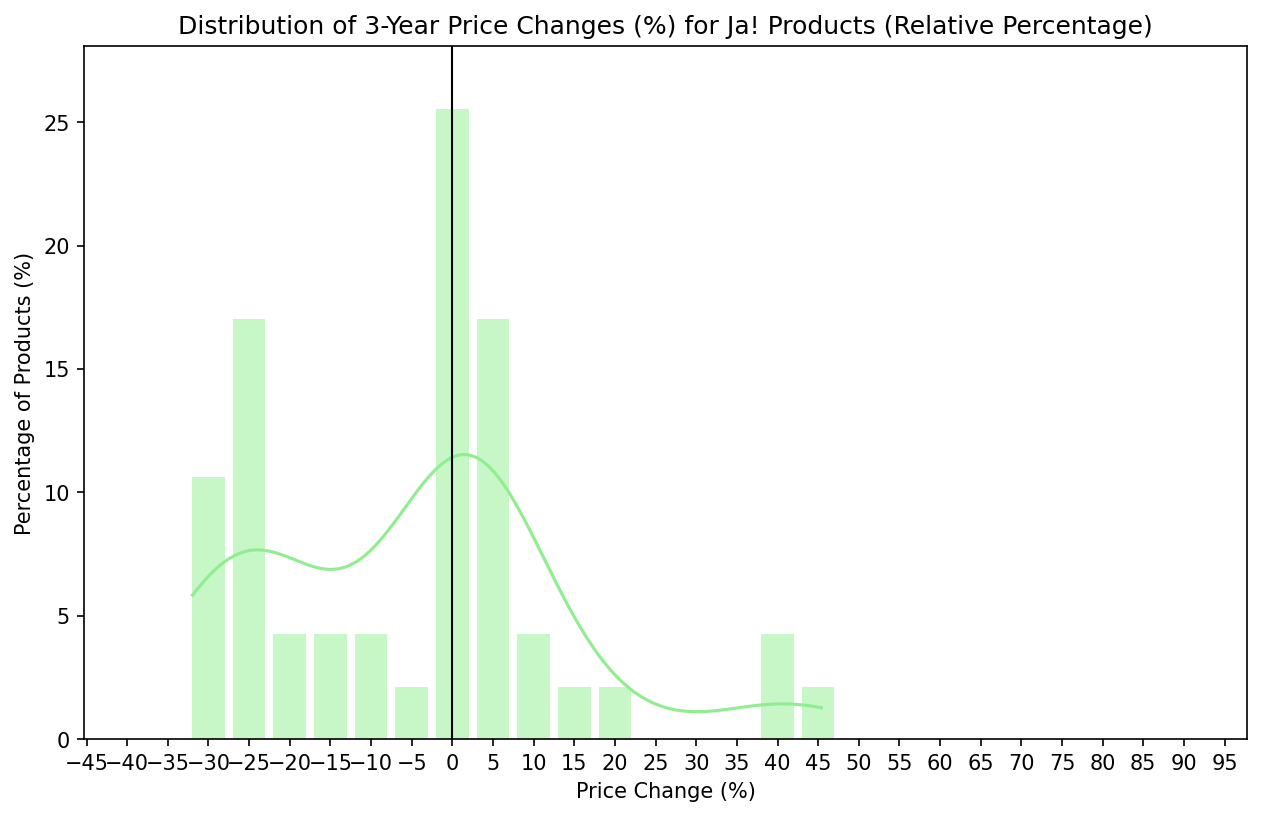
3-Year Price Change Analysis
Summary Statistics
Bins: 29 Range: -45.26% to 97.75%
| Brand Category | Product Count | Below Range | Above Range |
|---|---|---|---|
| Clever | 12 | 0.00% | 0.00% |
| BILLA | 109 | 0.00% | 3.67% |
| Ja! | 47 | 0.00% | 0.00% |
| Other Brands | 1557 | 1.09% | 0.90% |
Comparison of All Brand Categories
Individual Brand Category Distributions
Clever Products
BILLA Products
Ja! Products
Other Brands